We’re more than fun. We’re research based.

Muzology has a consistent track record of exceptional results. Muzology works. We'll let the numbers do the talking.

Knox County 2015 Graph

Knox County Schools (Knoxville, TN) - 2015

RANDOMIZED CONTROLLED TRIAL

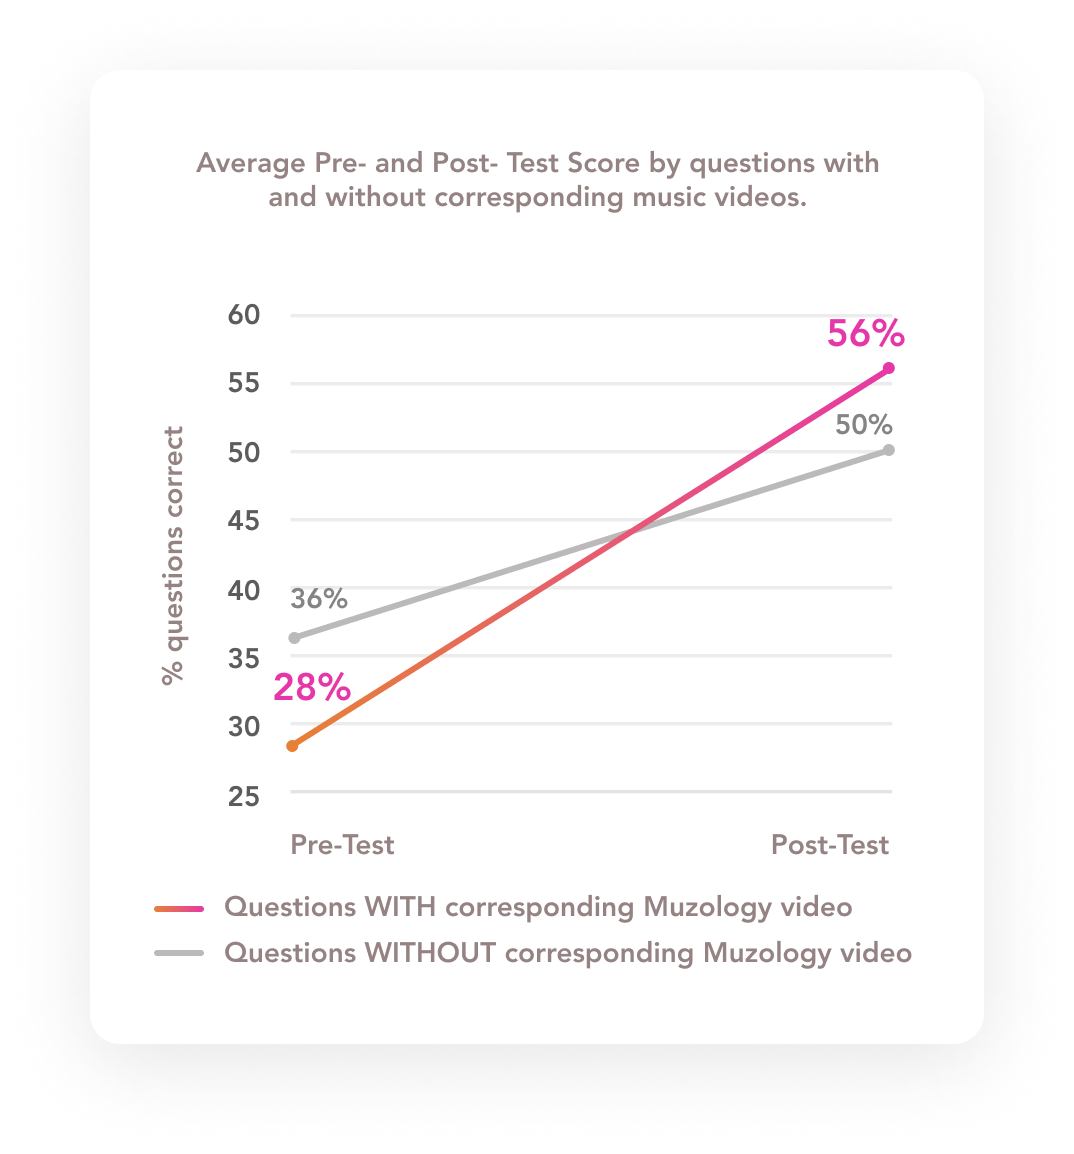
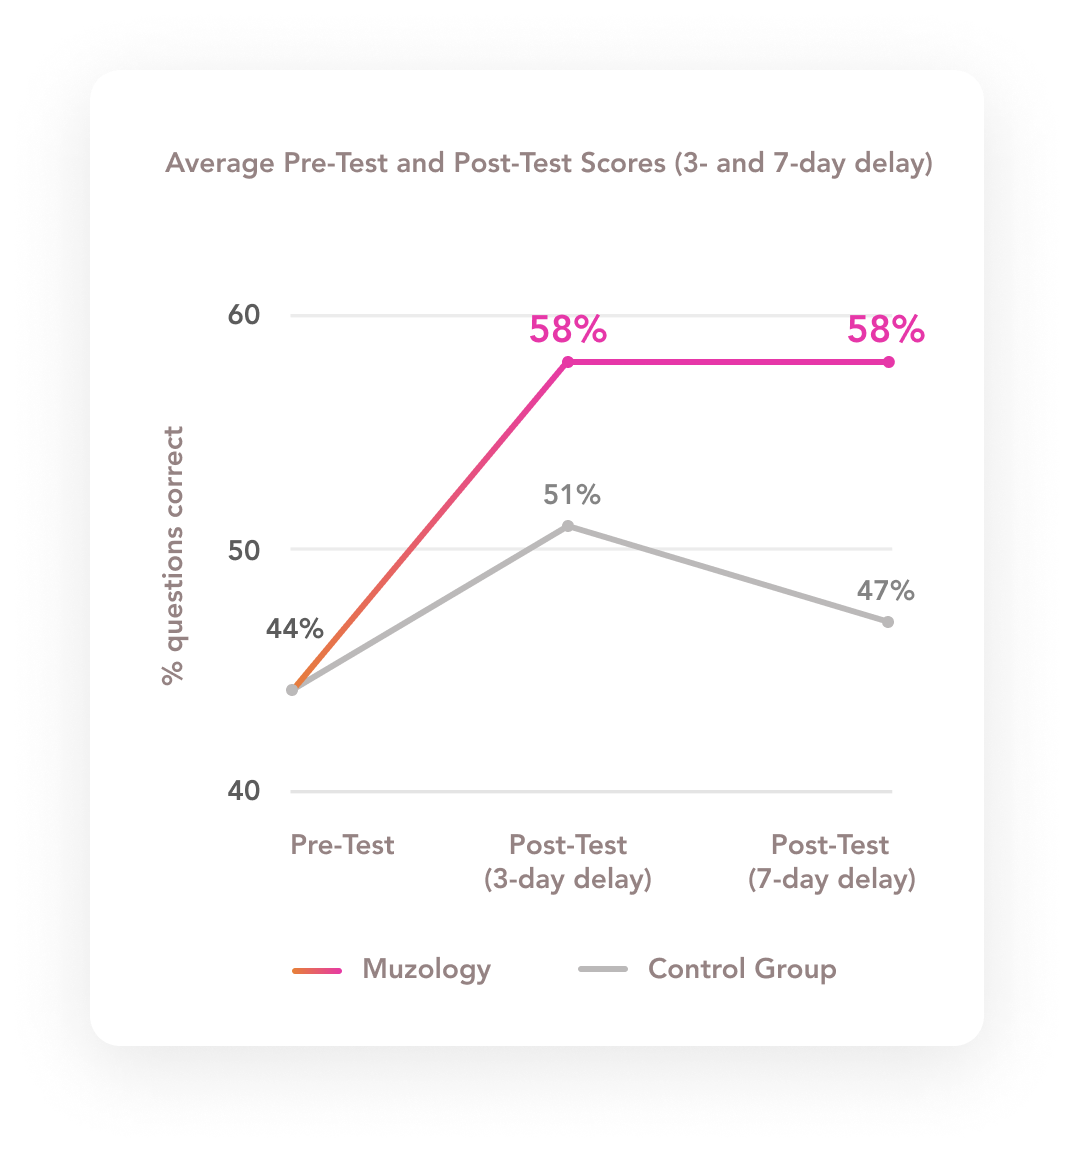
Participants were 62 low-performing 6th graders. The Muzology group viewed a series of music videos on fractions; the control group viewed videos with the same information presented conversationally. After a week delay (with no further exposure to the learning materials), the Muzology group retained their learning gains; however, the control group returned to near baseline levels, F (1, 60) = 4.84, p < .05, d =.44. Students in the Muzology group also answered twice as many questions correctly as compared to the control group, F (1, 62) = 5.64, p < .05, d =.3. Across conditions, students (71%) preferred the idea of learning with music videos vs. reading about math or watching videos of people talking about math.

Key Findings:

The Muzology group's outperformance is sustained, whereas the control group's performance drops to near baseline measures after a week.

Knox County 2016 Graph

Knox County Schools (Knoxville, TN) - 2016

SUMMER SCHOOL PILOT

During remedial summer school for outgoing 8th graders, 99% of students (n = 270) showed improvement from baseline on in-platform quizzes after watching music videos; 87% of students improved their baseline score by 50 points or more. On a district Pre/Post-Test diagnostic, students improved twice as much on questions with corresponding Muzology videos compared to questions for which there was no corresponding music video, F(1, 112) = 48.8, p < .05, η2 = .30.

Key Findings:

Average quiz performance doubles for questions with a corresponding Muzology video.

Knox County 2016/2017 Graph

Knox County Schools (Knoxville, TN) - 2016/17

DISTRICT IMPLEMENTATION

Muzology was integrated into students’ math instruction over the course of a full school year, across more than 3,400 students and 20 schools.
Pass/Fail Rates: Pre-Test pass rate (i.e., at least 70%) went from 35% (before watching a Muzology math music video) to 81% on the proficient level Post-Test (after watching a Muzology math music video).
Average Scores: Average Pre-Test score of 42% (before watching a Muzology math music video) increased to 74% (after watching a Muzology math music video) on the proficient level Post-Test.
Class Grades: Using district data on students’ class grades, the Rhodes Artificial Intelligence Lab at Oxford University utilized machine learning classification techniques and found positive correlations between students who were highly engaged with Muzology and students who received high grades in math.

Key Findings:

Quiz score pass rate increases from 35% to 81% (after watching a Muzology music video).

Knox County 2017 Graph

Knox County Schools (Knoxville, TN) - 2017

SUMMER SCHOOL IMPLEMENTATION

On a district Pre- and Post-Test diagnostic administered to 200+ outgoing 8th graders, 12% of students increased their performance by more than 40 points after using Muzology. At the start of the summer, 1% of students passed (i.e., scored at least 70%) the Pre-Test diagnostic. After using Muzology for 4-5 weeks, 11% of students passed the diagnostic.

Key Findings:

70% of students increase their district Diagnostic scores by 10 or more points after using Muzology for 4-5 weeks.

Hillsborough County 2017/2018 Graph

Hillsborough County Public Schools (Tampa, FL) - 2017/18

DISTRICT PILOT

In a nine-week pilot with more than 2,700 students in 6th-8th grades across 44 schools, average in-platform Pre-Test scores improved from 56% (before watching a Muzology math music video) to 84% on the proficient level Post-Test (after watching a Muzology math music video). 

Key Findings:

Average in-platform quiz scores more than double after students watch Muzology math music videos.

Little Rock, AR - 2019 Graph

Little Rock, AR - 2019

SCHOOL PILOT

At a Title I school (70% African American, 20% Hispanic; 97% free or reduced lunch), only 4% of 9th graders were at grade-level in math. Within days of watching Muzology math music videos, students who had never received an A in math were scoring 100% on in-platform quizzes. After 4 weeks on Muzology, 94% of students had earned perfect scores of 100% on proficient level Post-Tests; whereas only 8% of students had earned perfect scores on the Pre-Test prior to watching a Muzology math music video.

Key Findings:

94% of students score a perfect 100% on in-platform proficient level Post-Tests after watching a Muzology music video.

Arkansas - 2019/20 Graph

Arkansas - 2019/20

STATE PILOT

Based on promising outcomes from a school pilot, Arkansas expanded the Muzology pilot to 1,200 students across 18 schools and 8 districts. More than 13,000 videos were watched and more than 24,000 in-platform quizzes completed. Average in-platform Pre-Test scores improved from 50% (before watching a Muzology math music video) to 80% on proficient level Post-Tests (after watching a Muzology math music video). The most frequently occurring (i.e., statistical mode) in-platform score increased from 40% on the Pre-Test to a perfect 100% on the proficient level Post-Test.

Key Findings:

The most frequently occurring (i.e., statistical mode) in-platform score increases from 40% on the Pre-Test to a perfect 100% on the proficient level Post-Test. Simply put, there are more 100s earned the first time students take the Post-Test than any other score!

Hear from Some of our Fans!

It's one of the best resources that I've got, and I've been teaching for 30 years.
star
star
star
star
star

Shirley F, Math Dept. Chair

(Little Rock, AR)

Muzology is a lifesaver! It took the stress out of math and made it fun and easy for my child. I highly recommend this program to anyone whose child is learning math.
star
star
star
star
star

Susie L, Parent and psychologist

(Miami, FL)

I've always thought of math as a really boring subject. It's made math fun!
star
star
star
star
star

6h grader (Tampa, FL)

Join Now
Try Muzology Free Today!